Troubleshoot MCP Using ArcGIS Server Logs
When something goes wrong with the MCP catalog—a client can't connect, a platform web app fails to load, a tool call fails, or results look wrong—the ArcGIS Server logs are the first place to look. The MCP platform catalog writes its diagnostic entries directly into the ArcGIS Server log stream, so you can read them with the same tools you already use for ArcGIS Server, no extra logging system required.
This page explains where MCP log entries appear, what gets logged, and how to query the logs for troubleshooting.
Note: You must be signed in as an administrator (for example,
siteadmin) of the ArcGIS Server site to read the logs.
Where MCP entries appear
MCP entries are written into the ArcGIS Server logs and are tagged so you can pick them out:
- Target / source:
MCP_SERVER— the Target column identifies the entry as coming from the MCP platform catalog. Filtering or scanning forMCP_SERVERisolates MCP activity from the rest of the server's logging. - Code:
9999— in the sample deployments these entries are logged under code9999, which you can use as an additional filter.
Each entry includes the usual ArcGIS Server log columns—Type (level), Message, Time, Target, Machine, User, Code, Time Elapsed, Process, Thread, and Method Name.
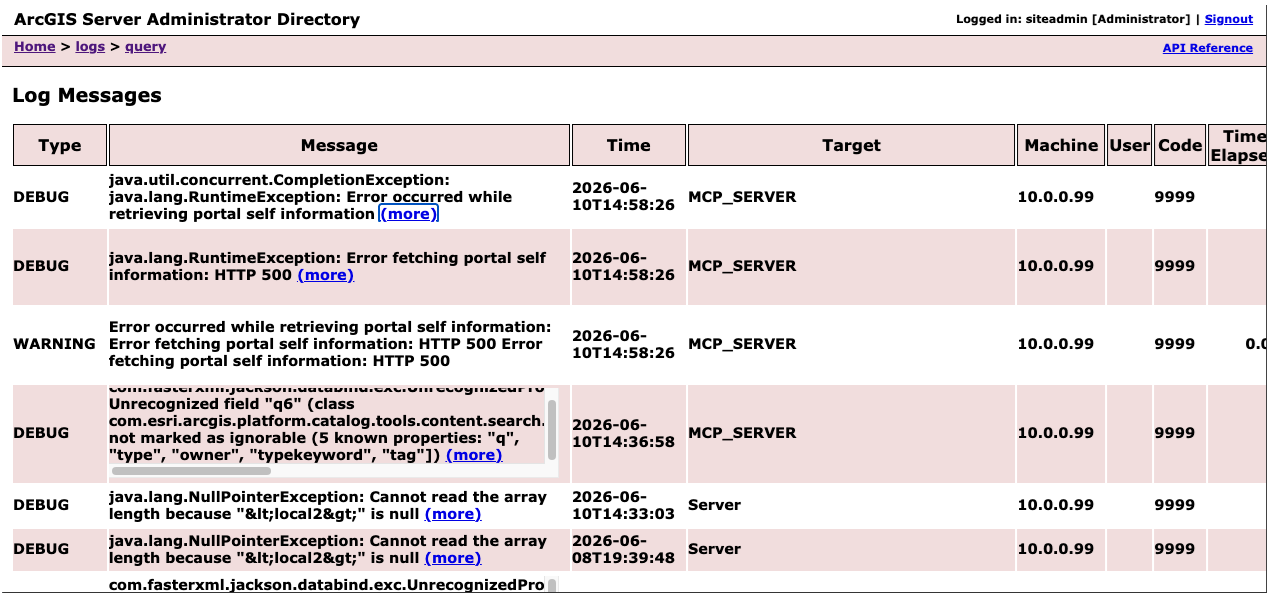
MCP entries in the ArcGIS Server Administrator Directory, identified by the MCP_SERVER target.
What gets logged
MCP logs at several severity levels. Knowing what lands at each level helps you choose the right log level to query:
- Severe — serious failures, such as the platform catalog (MCP) application failing to start.
- Warning — outbound HTTP-client requests that outright fail (they do not return a normal
4xx/5xxresponse)—for example a TLS/certificate trust failure or a connection that can't be established. - Audit (informational) — audit entries for user requests, recording the requests that clients make against the MCP catalog.
- Debug — detailed diagnostics for bad tool calls, malformed HTTP requests, or requests that come back with an ArcGIS error object.
Tip: ArcGIS Server's configured log level controls how much of this is actually written. By default ArcGIS Server logs at Warning, so audit and debug entries are not captured until you raise the level. To capture them, set the ArcGIS Server log level to Debug (ArcGIS Server Manager → Logs → Settings, or the
admin/logs/settingsoperation), reproduce the problem, query the logs, then set the level back to its original value to avoid excessive log growth.
Query the logs
Option A — ArcGIS Server Administrator Directory (browser)
The Administrator Directory provides a simple query form:
- Sign in to the ArcGIS Server Administrator Directory as an administrator. Through a web adaptor this is
https://<server>/<web-adaptor>/admin; directly against the server it ishttps://<server>:6443/arcgis/admin. - Go to Home → logs → query.
- Set the level (start with Warning for failures, or Debug to see tool-call and request detail), optionally set a start/end time, and submit.
- In the results, look at the Target column for
MCP_SERVERentries.
To focus on MCP activity, enter 9999 in the Log Codes filter; raise Messages Per Page if you need more rows per query.
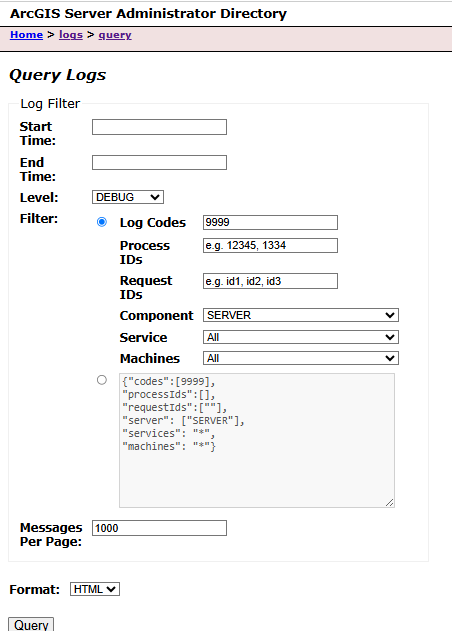
The Query Logs form—set the Level and, optionally, a Log Code of 9999 to focus on MCP entries.
Option B — Admin API (REST)
You can call the logs query operation directly. It accepts the request parameters in the URL (or as a POST body):
https://<server>/<web-adaptor>/admin/logs/query?level=DEBUG&filterType=json&filter={"codes":["9999"]}&startTime=&endTime=&f=json
Or directly against the server port:
https://<server>:6443/arcgis/admin/logs/query?level=WARNING&filterType=json&filter={"codes":["9999"]}&f=json
Useful parameters:
level— the minimum severity to return:SEVERE,WARNING,INFO,FINE,VERBOSE, orDEBUG.startTime/endTime— bound the time window (leave empty for the most recent entries).filterType=jsonwithfilter— a JSON object to narrow results. For example,{"codes":["9999"]}restricts results to the MCP code. The filter also supports keys such asservices,machines, andusers.f=json— return JSON instead of HTML.
Note:
levelreturns that severity and everything more severe. Querying atDEBUGreturns debug, info/audit, warning, and severe entries; querying atWARNINGreturns only warning and severe.
Reading common entries
A few representative MCP messages and what they usually mean:
Error fetching portal self information: HTTP 500(andError occurred while retrieving portal self information) — the MCP server could not retrieve the portal's self information. Typically a connectivity, authentication, or portal-side problem between the MCP server and the portal.PKIX path building failed … unable to find valid certification path to requested target— a TLS trust problem: the MCP server's HTTP client does not trust the certificate presented by the target (portal or server). Import the target's certificate (and any intermediate CA certificates) into the trust store the ArcGIS Server JVM uses.Unrecognized field "q6" … not marked as ignorable (5 known properties: "q","type","owner","typekeyword","tag")— a tool call sent a parameter the tool does not accept. The five listed properties are the valid fields for that operation (here, the structured search ofsearch_portal_content); the client sent an unsupported one.
Tip: Use the (more) link in the Administrator Directory (or read the full
messagefield in the JSON response) to see the complete stack trace—the truncated message in the table rarely tells the whole story.
When to raise the log level
For most "it isn't working" reports, this sequence works well:
- Set the ArcGIS Server log level to Debug.
- Reproduce the failing action from the MCP client (the connection attempt, the prompt, the tool call).
- Query the logs for
MCP_SERVERentries around that time. - Identify the most severe relevant entry and read its full message/stack trace.
- Return the log level to its original setting.
If the entries point to an MCP defect rather than a configuration issue, submit your findings—ideally with the full message text and the steps to reproduce—on the Early Adopter Community (EAC) forum.
If for any reason, you want to remove the deployed MCP overlay, refer to Remove the MCP Overlay.